Q1GATE 2025MCQ
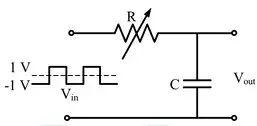
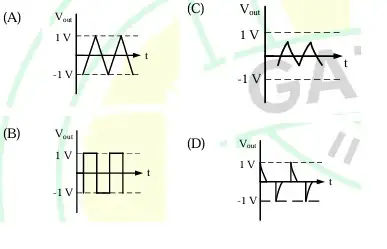
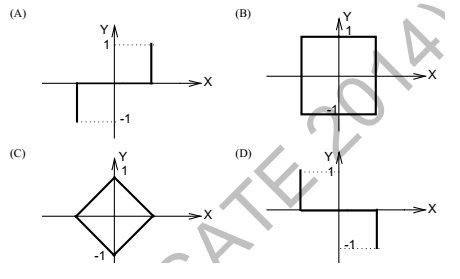
In the circuit, shown below, if the values of R and C are very large, the form of the output voltage for a very high frequency square wave input, is best represented by
GATE EE · Electrical And Electronic Measurements
Generate GATE-level questions on Electronic instruments. Focus on: 1. Cathode Ray Oscilloscope (CRO): Measurement of Voltage, Frequency, and Phase (Lissajous patterns). 2. Digital Voltmeters (DVM) and Multi-meters. 3. Q-meter: Working principle and Measurement of Q-factor.
22 questions · 20 PYQs · 0 AI practice · GATE EE 2027
🎯 These are sample questions
Just sign in to unlock everything. Free for all students.
In the circuit, shown below, if the values of R and C are very large, the form of the output voltage for a very high frequency square wave input, is best represented by
A stationary closed Lissajous pattern on an oscilloscope has 3 horizontal tangencies and 2 vertical tangencies for a horizontal input with frequency 3 kHZ. The frequency of the vertical input is
The slope and level detector circuit in a CRO has a delay of 100 ns. The start-stop sweep generator has a response time of 50 ns. In order to display correctly, a delay line of
A digit timer counter possesses a base clock of frequency 100 MHz. When measuring a particular input, the reading obtained is the same in: (i) Frequency mode of operation with a gating time of one second and (ii) Period mode of operation (in the x 10 ns scale). The frequency of the unknown input (reading obtained) in Hz is _______.
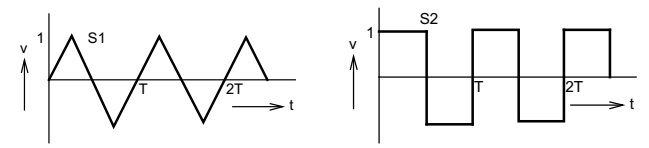
The two signals S1 and S2, shown in figure, are applied to Y and X deflection plates of an oscilloscope. The waveform displayed on the screen is
In an oscilloscope screen, linear sweep is applied at the
A dual trace oscilloscope is set to operate in the ALTernate mode. The control input of the multiplexer used in the y-circuit is fed with a signal having a frequency equal to
A digit DMM has the error specification as: 0.2% of reading + 10 counts. If a dc voltage of 100 V is read on its 200 V full scale, the maximum error that can be expected in the reading is
The two inputs of a CRO are fed with two stationary periodic signals. In the X-Y mode, the screen shows a figure which changes from ellipse to circle and back to ellipse with its major axis changing orientation slowly and repeatedly. The following inference can be made from this.
An average-reading digital multi-meter reads 10 V when fed with a triangular wave, symmetric about the time-axis. For the same input an rms-reading meter will read
Two 8-bit ADCs, one of single slope integrating type and other of successive approximate type, take times to convert 5 V analog input signal to equivalent digital output. If the input analog signal is reduced to 2.5 V, the approximate time taken by the two ADCs will respectively, be
Two sinusoidal signals and are applied to X and Y inputs of a dual channel CRO. The Lissajous figure displayed on the screen shown below : The signal will be represented as

The probes of a non-isolated, two channel oscillocope are clipped to points A, B and C in the circuit of the adjacent figure. is a square wave of a suitable low frequency. The display on are as shown below. Then the "Signal" and "Ground" probes and of respectively are connected to points :

The time/div and voltage/div axes of an oscilloscope have been erased. A student connects a 1 kHz, 5 V p-p square wave calibration pulse to channel-1 of the scope and observes the screen to be as shown in the upper trace of the figure. An unknown signal is connected to channel-2(lower trace) of the scope. It the time/ div and V/div on both channels are the same, the amplitude (p-p) and period of the unknown signal are respectively

A digital-to-analog converter with a full-scale output voltage of 3.5 V has a resolution close to 14 mV. Its bit size is
The simultaneous application of signals x(t) and y(t) to the horizontal and vertical plates, respectively, of an oscilloscope, produces a vertical figure of 8 display. If P and Q are constants and X(t)= , then y(t) is equal to
The Q-meter works on the principle of
A CRO probe has an impedance of 500 in parallel with a capacitance of 10 pF. The probe is used to measure the voltage between P and Q as shown in figure. The measured voltage will be

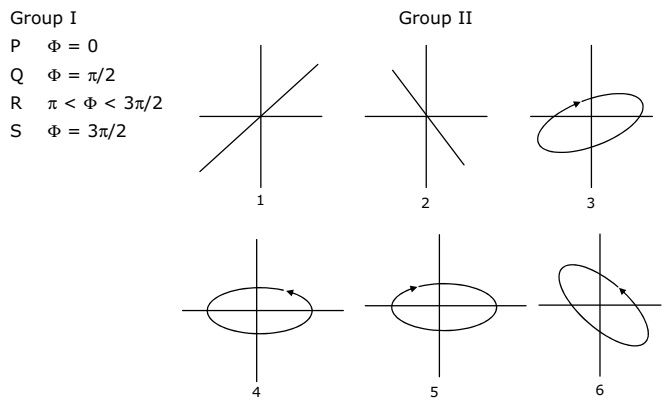
Group-II represents the figures obtained on a CRO screen when the voltage signals and are given to its X and Y plates respectively and is changed. Choose the correct value of from Group-I to match with the corresponding figure of Group-II
The simplified block diagram of a 10-bit A/D converter of dual slope integrator type is shown in figure. The 10-bit counter at the output is clocked by a 1 MHz clock. Assuming negligible timing overhead for the control logic, the maximum frequency of the analog signal that can be converted using this A/D converter is approximately

Want unlimited AI-generated Cro And Electronic Measurements questions?
Sign up free and practice with adaptive difficulty — Easy, Medium, Hard. New questions every session.
Start practising for free →