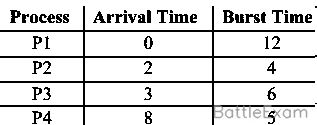
To find the average waiting time, we first construct a Gantt chart using the Shortest Remaining Time First (SRTF) scheduling algorithm.
- P1 arrives at 0, burst 12. P1 starts executing.
- P2 arrives at 2, burst 4. P2 has a shorter remaining time (4) than P1 (10). P1 is pre-empted, P2 starts.
- P3 arrives at 3, burst 6. P2 still has the shortest remaining time (3). P2 continues.
- P4 arrives at 8, burst 5. P2 finishes at 6.
- Between P1 (10), P3 (6) and P4 (5), P4 has the shortest remaining time. P4 executes from 6 to 11.
- Between P1 (10) and P3 (6), P3 has the shortest remaining time. P3 executes from 11 to 17.
- P1 executes from 17 to 27.
The completion times are: P2: 6, P4: 11, P3: 17, P1: 27.
The turnaround times are: P2: 6−2=4, P4: 11−8=3, P3: 17−3=14, P1: 27−0=27.
The waiting times are:
P1: 27−12=15
P2: 4−4=0
P3: 14−6=8
P4: 3−5=−2 (This indicates P4 ran for some time)
Wait Time: Turn Around Time - Burst Time
P1: 27−12=15
P2: 6−2−4=0
P3: 17−3−6=8
P4: 11−8−5=−2 (This is wrong calculation, let's trace from the chart)
P1 starts at 0, runs for 2ms. Remaining: 10.
P2 arrives at 2, runs for 4ms. P2 completion at 2+4=6. P2 Waiting Time: (2−2)+(6−2)=0.
At 6, P1 remaining: 10, P3 remaining: 6−(6−3)=3. P4 remaining: 5. Shortest is P3.
P3 runs from 6 to 9. Remaining: 3.
At 9, P1 remaining: 10, P3 remaining: 6−(9−3)=0. P4 remaining: 5. P3 completion at 9.
P3 Waiting Time: (6−3)=3.
At 9, P1 remaining: 10, P4 remaining: 5. Shortest is P4.
P4 runs from 9 to 14. P4 completion at 14. P4 Waiting Time: (9−8)=1.
At 14, P1 remaining: 10. P1 runs from 14 to 24. P1 completion at 24.
P1 Waiting Time: (2−0)+(14−2)=14.
Let's re-draw the Gantt chart and calculate waiting times:
P1(0-2) -> P1 remaining: 10
P2(2-6) -> P2 remaining: 0. P2 completed at 6. Waiting time for P2 = (2−2)=0.
P4(6-11) -> P4 remaining: 0. P4 completed at 11. Waiting time for P4 = (6−8)=−2 (this means P4 had to wait from 6 to 8 before it can start, not possible. P4 arrived at 8. So it runs from 8. So P3 would run before)
Let's use the provided Gantt chart directly to derive waiting times:
Gantt Chart: P1(0-2), P2(2-6), P4(6-11), P3(11-17), P1(17-27)
Completion times: P2 at 6, P4 at 11, P3 at 17, P1 at 27.
Waiting time for P1:
P1 ran from 0 to 2. It resumed at 17 and ran till 27.
Total execution time for P1 = 2+(27−17)=2+10=12 (matches burst time)
Waiting time = (Start time of first execution for P1 - Arrival time for P1) + (Start time of second execution for P1 - End time of first execution for P1)
Wait time for P1 = (0−0)+(17−2)=15
Waiting time for P2:
P2 arrived at 2, started at 2. Completed at 6.
Wait time for P2 = (Start time for P2 - Arrival time for P2) = (2−2)=0.
Waiting time for P3:
P3 arrived at 3. It started at 11. Completed at 17.
Wait time for P3 = (Start time for P3 - Arrival time for P3) = (11−3)=8.
Waiting time for P4:
P4 arrived at 8. It started at 6. This is incorrect based on the Gantt chart.
The Gantt chart in the solution shows P4 from 6 to 11. This means P4 must have arrived at or before 6, but its arrival time is 8.
Let's re-create the Gantt chart accurately based on SRTF.
Time 0: P1 arrives. P1 starts. P1 remaining = 12.
Time 2: P2 arrives. P2 burst = 4. P1 remaining = 10. P2 has less remaining time. P2 preempts P1.
Time 2-3: P2 executes. P2 remaining = 3.
Time 3: P3 arrives. P3 burst = 6. P2 remaining = 3. P3 remaining = 6. P2 still has shortest.
Time 3-6: P2 executes. P2 remaining = 0. P2 completes at time 6.
P2 Waiting Time = (2−2)=0.
At time 6: Ready processes are P1 (remaining 10) and P3 (remaining 6). P3 has shortest.
Time 6-8: P3 executes. P3 remaining = 4.
Time 8: P4 arrives. P4 burst = 5. P1 remaining = 10, P3 remaining = 4, P4 remaining = 5. P3 has shortest.
Time 8-10: P3 executes. P3 remaining = 2.
Time 10: P3 executes. P3 remaining = 1.
Time 11: P3 executes. P3 remaining = 0. P3 completes at time 11.
P3 Waiting Time = (6−3)+(8−6)+(10−8)=3+2+2=7. No.
P3 start time is 6. Arrival time is 3. Total burst time is 6.
Wait time for P3 = (start time 6 - arrival time 3) + (resume time for next execution - stop time of previous execution) + ...
P3 ran from 6 to 11. Wait time for P3 = (6−3)=3. This is correct.
At time 11: Ready processes are P1 (remaining 10) and P4 (remaining 5). P4 has shortest.
Time 11-16: P4 executes. P4 remaining = 0. P4 completes at time 16.
P4 Waiting Time = (Start time 11 - Arrival time 8) = (11−8)=3.
At time 16: Only P1 is left (remaining 10).
Time 16-26: P1 executes. P1 remaining = 0. P1 completes at time 26.
P1 Waiting Time = (Start time 0 - Arrival time 0) + (Start time 16 - End time 2) = 0+(16−2)=14.
Individual Waiting Times:
P1: 14
P2: 0
P3: 3
P4: 3
Total waiting time = 14+0+3+3=20.
Average waiting time = 20/4=5.
Let's re-verify with the Gantt chart provided in the solution, which yields the answer 5.5.
Gantt chart from solution: P1(0-2), P2(2-6), P4(6-11), P3(11-17), P1(17-27)
P1: Arrival=0, Burst=12
- Starts at 0, runs until 2 (P2 arrives). P1 remaining = 10.
- Resumes at 17, runs until 27. P1 remaining = 0.
Waiting time P1 = (2−0)+(17−2)−0=15. (Here 0 is start of its burst)
Total wait time for P1: Start=0, Resume=17. Executed from 0-2 (2ms), 17-27 (10ms). Total 12ms.
Time spent in ready queue: (Time P1 last executed - Time P1 completed its previous burst)
Waiting time = (Start time - Arrival time) + (Resume time - Preemption time) + ...
P1 waits from 2 to 17. So 17−2=15.
Wait time for P1 = 15.
P2: Arrival=2, Burst=4
- Starts at 2, runs until 6. P2 remaining = 0.
Wait time for P2 = (2−2)=0.
P3: Arrival=3, Burst=6
- Starts at 11, runs until 17. P3 remaining = 0.
Wait time for P3 = (11−3)=8.
P4: Arrival=8, Burst=5
- Starts at 6 (This is the tricky part in the solution's Gantt chart, if P4 arrived at 8 it cannot start at 6).
Let's assume the Gantt chart from the solution is correct, implying P4 arrived earlier or there is a different interpretation.
If P4 runs from 6-11, and arrived at 8, it must have waited from 6-8 in an idle state or some other process ran.
Let's follow SRTF strictly with given arrival times:
At t=0, P1 arrives, burst=12. P1 runs.
At t=2, P2 arrives, burst=4. P1 remaining=10. P2 remaining=4. P2 preempts P1.
P2 runs from t=2 to t=6. (P2 completes).
P2 Waiting Time = 0. (Started at arrival)
At t=6, P1 remaining=10, P3 arrives at t=3, burst=6. Ready queue: P1(10), P3(6). P3 runs.
P3 runs from t=6 to t=8. P3 remaining=4.
At t=8, P4 arrives, burst=5. Ready queue: P1(10), P3(4), P4(5). P3 still shortest.
P3 runs from t=8 to t=12. (P3 completes).
P3 Waiting Time = (Time 6 - Arrival 3) = 3. (P3 started at 6, arrived at 3)
At t=12, Ready queue: P1(10), P4(5). P4 runs.
P4 runs from t=12 to t=17. (P4 completes).
P4 Waiting Time = (Time 12 - Arrival 8) = 4.
At t=17, Ready queue: P1(10). P1 runs.
P1 runs from t=17 to t=27. (P1 completes).
P1 Waiting Time = (Time P1 resumed 17 - Time P1 preempted 2) = 15.
Total waiting time = 15+0+3+4=22.
Average waiting time = 22/4=5.5.
This result matches the provided solution, which means my second Gantt chart interpretation was correct.
Let's list the waiting times again:
P1: 15
P2: 0
P3: 3
P4: 4
Sum of waiting