Q21GATE 2021NAT
Spot speeds of vehicles observed at a point on a highway are 40, 55, 60, 65 and 80 km/h. The space-mean speed (in km/h, round off to two decimal places) of the observed vehicles is ______________
GATE CE · Transportation Engineering
Generate GATE-level questions on Traffic Engineering in Transportation Engineering. Focus on core concepts, previous year patterns, and numerical problem-solving techniques.
81 questions · 20 PYQs · 0 AI practice · GATE CE 2027
Spot speeds of vehicles observed at a point on a highway are 40, 55, 60, 65 and 80 km/h. The space-mean speed (in km/h, round off to two decimal places) of the observed vehicles is ______________
Vehicular arrival at an isolated intersection follows the Poisson distribution. The mean vehicular arrival rate is 2 vehicle per minute. The probability (round off to two decimal places) that at least 2 vehicles will arrive in any given 1-minute interval is _____
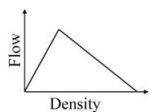
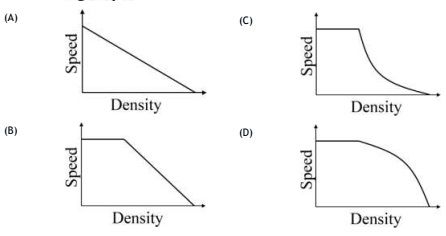
The flow-density relationship of traffic on a headway is shown in the figure. The correct representation of speed-density relationship of the traffic on this highway is
Traffic volume count has been collected on a 2 lane road section which needs upgradation due to severe traffic flow condition. Maximum service flow rate per lane is observed as 1280 veh/h at level of service 'C'. The Peak Hour Factor is reported as 0.78125. Historical traffic volume count provides Annual Average Daily Traffic as 122270 veh/day. Directional split of the traffic flow is observed to be 60 : 40. Assuming that traffic stream consists of 'All Cars' and all drivers are 'Regular Commuters', the number of extra lane(s) (round off to the next higher integer) to be provide, is ________.
24-h traffic count at a road section was observed to be 1000 vehicles on a Tuesday in the month of July. If daily adjustment factor for Tuesday is 1.121 and monthly adjustment factor for July is 0.913, the Annual Average Daily Traffic (in veh/day, round off to the nearest integer) is _______.
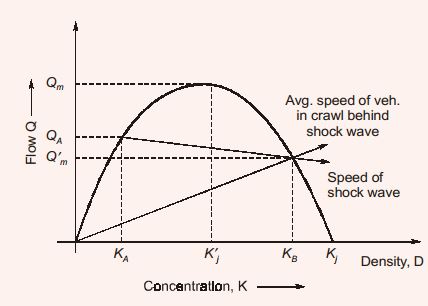
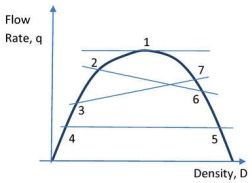
The relationship between traffic flow rate (q) and density (D) is shown in the figure. The shock wave condition is depicted by
The traffic starts discharging from an approach at an intersection with the signal turning green. The constant headway considered from the fourth or fifth headway position is referred to as
Traffic on a highway is moving at a rate of 360 vehicles per hour at a location. If the number of vehicles arriving on this highway follows Poisson distribution, the probability (round off to 2 decimal places) that the headway between successive vehicles lies between 6 and 10 seconds is ______
A vehicle is moving on a road of grade +4% at a speed of 20 m/s. Consider the coefficient of rolling friction as 0.46 and acceleration due to gravity as 10 . On applying brakes to reach a speed of 10 m/s, the required braking distance (in m, round off to nearest integer) along the horizontal, is ______
The speed-density relationship of a highway is given as u=100-0.5k where, u = speed in km per hour, k = density in vehicles per km. The maximum flow (in vehicles per hour, round off to the nearest integer) is ______
The uniform arrival and uniform service rates observed on an approach road to a signalized intersection are 20 and 50 vehicles/minute, respectively. For this signal, the red time is 30 s, the effective green time is 30 s, and the cycle length is 60 s. Assuming that initially there are no vehicles in the queue, the average delay per vehicle using the approach road during a cycle length(in s, round off to 2 decimal places) is ______
The maximum number of vehicles observed in any five minute period during the peak hour is 160. If the total flow in the peak hour is 1000 vehicles, the five minute peak hour factor (round off to 2 decimal places) is ___
The speed-density relationship in a mid-block section of a highway follows the Greenshield's model. If the free flow speed is and the jam density is , the maximum flow observed on this section is
The space mean speed (kmph) and density (vehicles/km) of a traffic stream are linearly related. The free flow speed and jam density are 80 kmph and 100 vehicles/km respectively. The traffic flow (in vehicles/h, up to one decimal place) corresponding to a speed of 40 kmph is ______
A well-designed signalized intersection is one in which the
Peak Hour Factor (PHF) is used to represent the proportion of peak sub-hourly traffic flow within the peak hour. If 15-minute sub-hours are considered, the theoretically possible range of PHF will be
The speed-density relationship for a road section is shown in the figure. The shape of the flow-density relationship is
Two cars P and Q are moving in a racing track continuously for two hour. Assume that no other vehicles are using the track during this time. The expressions relating the distance travelled d (in km) and time t (in hour) for both the vehicles are given as P: Q: Within the first one hour, the maximum space headway would be
Vehicles arriving at an intersection from one of the approach road follow the Poisson distribution. The mean rate of arrival is 900 vehicles per hour. If a gap is defined as the time difference between two successive vehicle arrivals (with vehicles assumed to be points), the probability (up to four decimal places) that the gap is greater than 8 seconds is
The safety within a roundabout and the efficiency of a roundabout can be increased, respectively, by
Want unlimited AI-generated Traffic Engineering questions?
Sign up free and practice with adaptive difficulty — Easy, Medium, Hard. New questions every session.
Start practising for free →